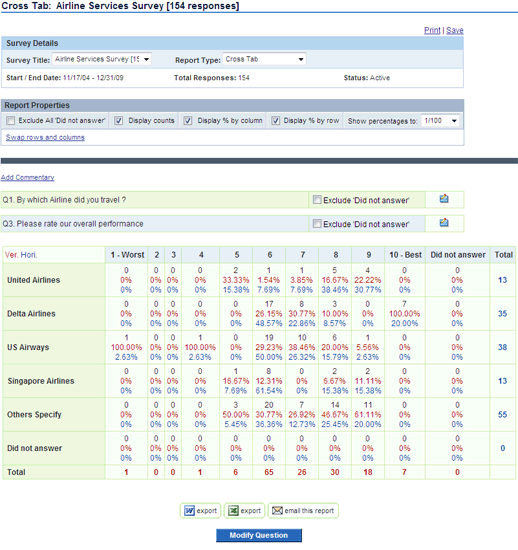
The Cross Tab report offers survey analysts the ability to drill down
into two to three different data points to uncover correlations.
+Attributes
- Cross compares X and Y variables
- Display counts and/or percentages
- Color-coded counts and percentages
- Exclude “Did not answer”
- Add comments
- MS Word and Excel export
- Email report
+Sample Application
A car dealership wants to know how female and male respondents answered a
specific question about the benefits of an extended warranty in their latest
customer satisfaction survey to improve selling techniques.


