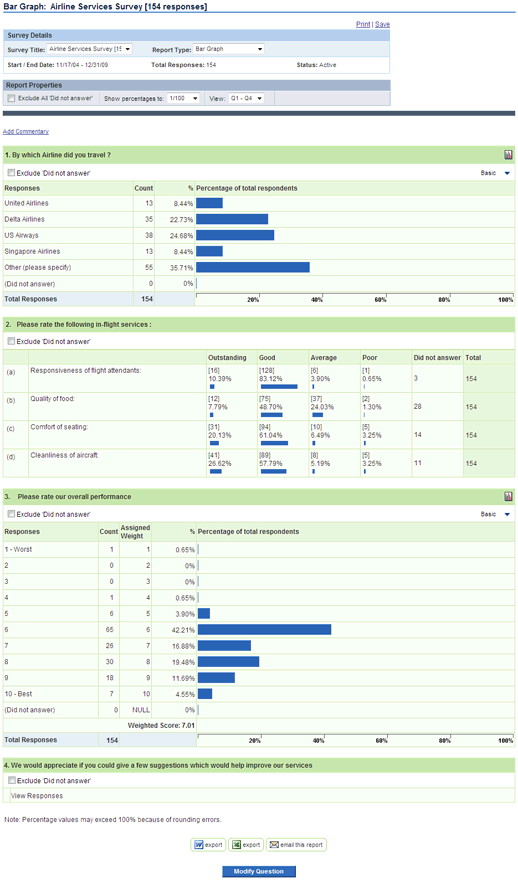
The Bar Graph report type displays an aggregate of the answer for all
questions.
+Attributes
- Customizable chart options
- Click specific answer for full report on all who selected option
- Horizontal and Vertical views
- Display counts and/or percentages
- Exclude “Did not answer”
- Add comments
- MS Word and Excel export
- Email report


