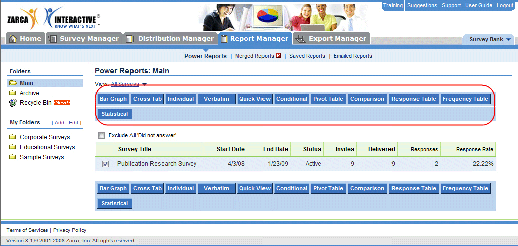
Our On-Demand data analysis and reporting engine offers users a greatly expanded set of analytic tools that includes:
- 11 robust, out-of-box reports
- 10 customizable charts and tables for data presentation
- Email Reports feature
- Data drill-down
- Crosstab and Pivot Table analysis
- Conditional and trend analysis
- Quantifiable open-text responses
- Ad hoc querying, on-the-fly data slicing and more
From the Report Manager main page, users can quickly access all Power Reports, aggregate results from multiple or past surveys, save and archive reports and send and save emailed reports.

Data Analysis & Reporting – A Quick Look
Survey ReportingView samples of and learn more about Zarca’s extensive list of advanced reports.
Custom Reports
View examples of Zarca’s chart and graph options with sharp-looking graphics.
Data Analysis Features
Learn how to combine surveys for aggregated analysis, email reports to colleagues and conduct longitudinal analysis.


