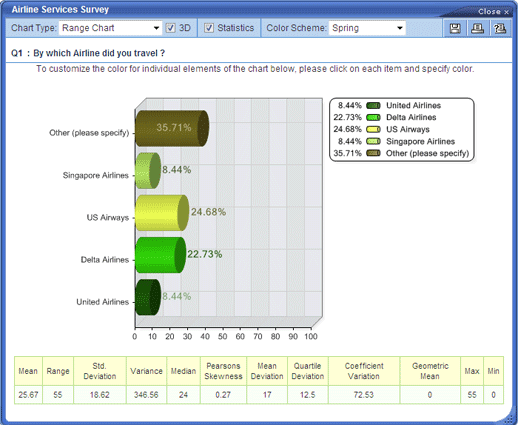
The custom chart option is similar to the cylinder chart except that the
results are presented along the Y-axis instead of the X-axis.
+Attributes
- View in 3D
- Advanced Statistics
- Percentages
- Bar graph legend
- Custom color schemes

The custom chart option is similar to the cylinder chart except that the
results are presented along the Y-axis instead of the X-axis.
+Attributes
