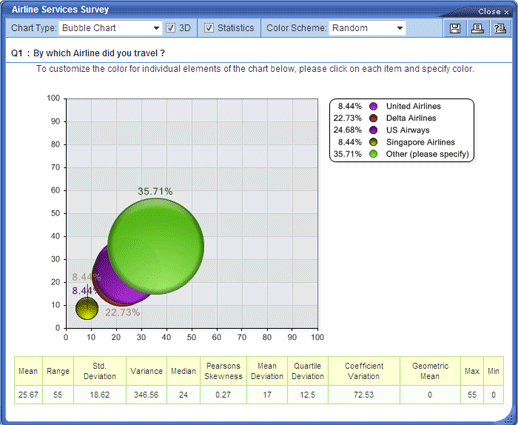
This custom chart type displays results to your survey questions as
bubbles, with their size relative to the number of responses (i.e. a lot of
relative responses = larger bubble).
+Attributes
- View in 3D
- Advanced Statistics
- Percentages
- Bar graph legend
- Custom color schemes